Explainer
AI and the Grid: What the Energy Boom Means for Investors
Understanding the structural shift in U.S. energy economics and the emergence of the Zero Marginal Cost Energy Market
Educational content for professional investors. Not investment advice or an offer. Full disclaimer below.
Executive Summary
There's been no shortage of headlines about how artificial intelligence is reshaping the U.S. power sector. With electricity demand surging and consumer bills rising, some commentators have drawn a straight line between AI data centers and higher household costs - the idea that "AI is driving up your electric bill."
There's some truth in that. But the story is more complicated - and for investors, far more interesting. When you dig into the details, you find that AI load growth is only one part of a broader structural shift in U.S. energy economics. It's also revealing deep inefficiencies in how power infrastructure is financed, regulated, and priced.
We believe this is a moment of opportunity: the emergence of what we call the Zero Marginal Cost Energy Market - a decade-long transformation where technologies that make energy systems more flexible, efficient, and intelligent will create enormous value.
How Big Is the AI Power Surge?
Across the United States, hyperscalers are building vast AI "factories" - data campuses drawing hundreds of megawatts each. Some will consume more electricity than entire cities.
This marks a decisive break from the past. For most of the 2010s, data-center energy use was flat despite explosive growth in digital traffic. Efficiency gains in chips, cooling, and workloads kept total consumption steady. That equilibrium has now collapsed. Large-language-model training and high-intensity inference workloads are adding a new, industrial-scale layer of demand - concentrated, constant, and hard to serve.
Demand for power for data centers is expected to rise significantly in the United States.
Terawatt-hours (TWh) of electricity demand, medium scenario
US data center energy consumption, TWh
Share of total US power demand, %
Source: Global Energy Perspective 2023, McKinsey, October 18, 2023; McKinsey analysis
In the U.S., data centers currently use about 5% of total electricity (~224 TWh). McKinsey forecasts that share will climb to nearly 12% by 2030, as total data-center power use triples. Within that, AI workloads make up 15-25% today and could exceed half of all data-center consumption by 2035, implying roughly a tenfold increase in AI-specific load.
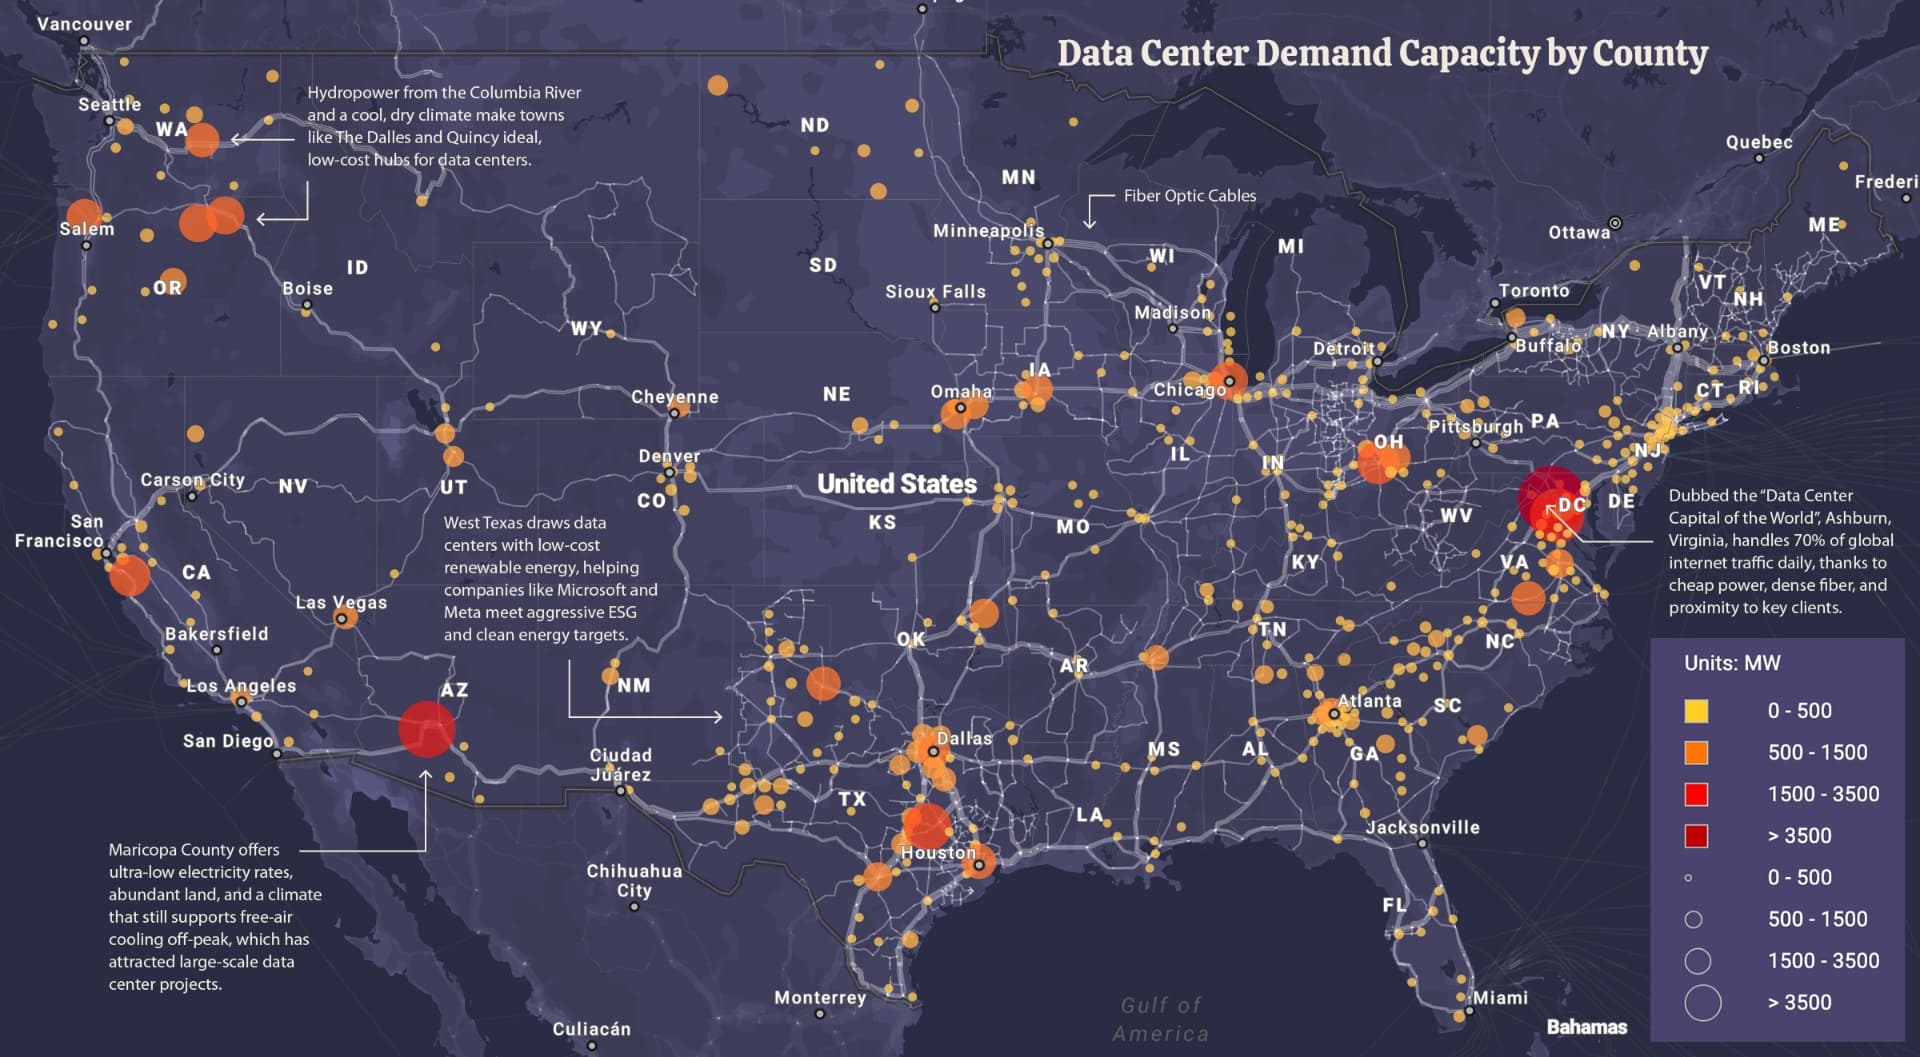
That growth has national implications - but the real strain is local. Data centers are clustering in markets like Virginia, Oregon, Iowa, and Nevada, where land, fiber, and power are cheap. In Virginia alone, data centers are estimated to account for around 40% of all electricity demand. Dominion Energy, the state's largest utility, expects demand growth to run three times faster than its historical average.
Data Centers Consume a Growing Share of Electricity
Share of total electricity consumption estimated to be used by data centers for a sample of US states
VIRGINIA
39%OREGON
33%IOWA
18%NEVADA
15%UTAH
15%NEBRASKA
14%ARIZONA
11%WYOMING
10%OHIO
9%ILLINOIS
7%GEORGIA
6%NEW JERSEY
6%WASHINGTON
6%TEXAS
5%NORTH DAKOTA
5%Are Consumers Paying for AI?
It's easy to assume so, given the sharp rise in retail electricity prices since 2021. But the picture is more nuanced.
A typical U.S. utility bill has two main parts:
- A regulated return on the utility's invested capital - its Regulated Asset Base (RAB).
- Pass-through fuel costs (mainly natural gas, coal, or oil).
Both components were already moving against consumers before AI arrived.
U.S. Rate Base Growth 2018-2022: Breakdown by Category
Distribution of $250B incremental capital expenditure above historical trend
| Category | Share | RAB Impact | Description |
|---|---|---|---|
| T&D Modernization & Reliability | ~45-50% | ~3.5 p.p. | Aging asset replacement, wildfire mitigation, automation, substation upgrades. |
| Renewable Integration | ~15-20% | ~1.0-1.5 p.p. | Wind/solar grid connections, inverter upgrades, visibility systems. |
| Grid Hardening & Resilience | ~10-15% | ~0.8-1.0 p.p. | Storm reinforcement, undergrounding, cyber-security programs. |
| Distribution Automation & IT | ~10% | ~0.6-0.7 p.p. | Smart meters, SCADA upgrades, analytics platforms. |
| New Generation (renewables) | ~10% | ~0.7 p.p. | Utility-owned solar, wind, gas peakers. |
| Load Growth & Electrification | <5% | ~0.3 p.p. | EV charging, heat pumps, early pilot investments. |
Between 2018 and 2022, aggregate U.S. rate base grew by about 7% a year, adding $250 billion in new regulated assets above trend. This spending spree had little to do with load growth. Instead, it reflected the simple fact that America's grid is old and needs replacing.
Roughly half of that investment went into modernizing transmission and distribution infrastructure; another quarter into connecting renewable generation and hardening the grid against storms and wildfires. Only 3-5% of pre-2022 spending was linked to new load growth from EVs or heat pumps. In short, most of the money would have been spent regardless of AI.
Then came supply shocks: natural gas price spikes, COVID-era supply-chain disruption, and U.S. tariffs on imported steel, aluminum, and electrical equipment - together adding 50-60% to grid equipment costs over the past five years.
Here's the irony: because that capex would have happened anyway, the extra demand from data centers has actually spread those fixed costs over a larger sales base, slightly diluting average costs.
EEI and NERC estimate that 30-40% of new AI load since 2023 can be met using existing or already-planned infrastructure, which means that, at least nationally, AI growth has so far muted rather than amplified retail rate increases.
Where AI Load Is Starting to Bite
That picture changes in places where data centers are concentrated. In Virginia, Dominion now expects around 20% of future investment to come from new demand - compared to less than 5% before 2023 - largely due to data centers.
PJM Forward Capacity Auction Prices ($/MW-day)
PJM Interconnection
And the impact is already visible in PJM, the country's largest electricity market, covering 13 states from Illinois to New Jersey. PJM's forward capacity auctions - which secure supply three years in advance - saw clearing prices explode from $29 to $270 per MW-day in 2024, an 830% increase. Zones with heavy data-center concentration, such as BGE (Maryland) and Dominion South (Virginia), cleared even higher, at $466 and $444 per MW-day respectively.
The next auction in 2025 hit PJM's newly imposed price cap at $329 per MW-day. Without that cap, PJM's own simulation suggested a clearing price near $389 per MW-day. The cause? Upward revisions to demand forecasts driven almost entirely by data-center growth. And, bear in mind, this auction is selling capacity to meet total forecast peak demand plus a margin of safety (reserve margin) of close to 20%!
For retail customers, those capacity costs translate into 10-20% higher bills, even though the demand forecasts are three years forward and based on the highest possible load scenario. This is where the "AI is driving up your bill" story finally becomes true - in specific markets where infrastructure and policy are colliding.
Forecasting on the High Side
The more troubling issue is how these forecasts are made. Hyperscalers have every incentive to overestimate demand to ensure power availability under all scenarios. Utilities, meanwhile, are incentivized to accommodate those forecasts because more capacity means more assets - and more earnings.
Regulators, often lacking the technical resources to challenge assumptions, tend to approve the plans. The result is a system biased toward overbuilding, funded by consumers whether or not the full demand materializes.
That's risky, because AI's energy intensity could fall dramatically. Early examples like DeepSeek, which trained a model larger than Meta's LLaMA using less than 10% of the training hours, show how quickly efficiency can change the trajectory of actual demand.
Controls create incentives
DeepSeek V3 is a very large-parameter, highly training-efficient Chinese AI model
Facebook, DeepSeek
What It Tells Us About the U.S. Utility Model
This debate over AI and bills reveals something deeper: a misalignment between infrastructure incentives and system efficiency.
- How can U.S. utilities have grown their asset base by 4-5% per year for three decades - outpacing both inflation and demand - yet still operate a grid that averages over 25 years old?
- Why hasn't there been a productivity revolution in grid planning or maintenance?
- And why should consumers pay the same 10% regulated return on half-century-old infrastructure as they do on new assets?
Old and older
Advanced economy power networks and equipment are old
NREL, DOE
Age of US power transformer fleet
20% of in-service US power transformers
T&D more than 20 years old
Note: SEA is Southeast Asia.
T&D is transmission and distribution
These aren't abstract policy questions. They go to the heart of how value - and inefficiency - accrues in the U.S. electricity system. The result is a transmission and distribution network that is ripe for disruption, both technologically and regulatory.
Investment Implications
From an investment standpoint, three themes emerge:
1. The Capex Boom
The capex boom is real - and durable. Suppliers of transformers, switchgear, cables, and grid software ("the picks and shovels") will remain direct beneficiaries.
2. Data-Center Flexibility
Solutions that make data-center load more responsive - such as Emerald AI's orchestration platform - should see rapid adoption as utilities and regulators push for controllable demand.
3. Off-Grid Generation
Off-grid generation and storage - colocated renewables, batteries, and modular nuclear - will attract hyperscalers seeking energy security and price stability.
By contrast, investors should approach traditional regulated utilities with caution. Their rate-base growth story now carries higher political and regulatory risk, as policymakers begin to question who really benefits from perpetual capex expansion.
The Bottom Line
AI may be reshaping electricity demand, but the real story lies in the system it's exposing - one that rewards asset growth over efficiency.
Investors who understand this nuance will see opportunity in the technologies, business models, and market reforms that make the grid smarter, cleaner, and ultimately cheaper to run.
To learn more about where we see emerging investment opportunities in the Energy Transition, look through our Energy Transition Investment Primer.